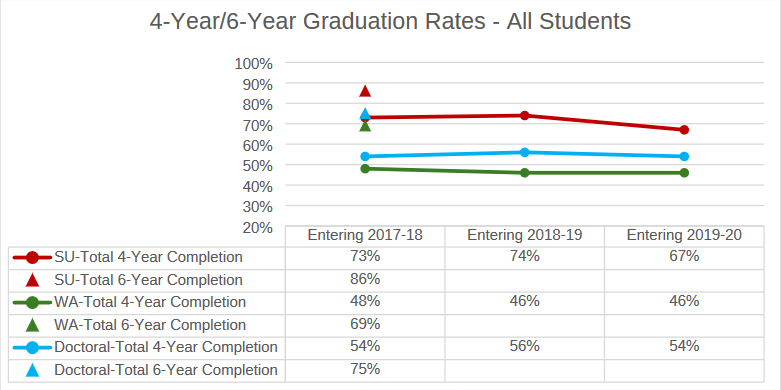
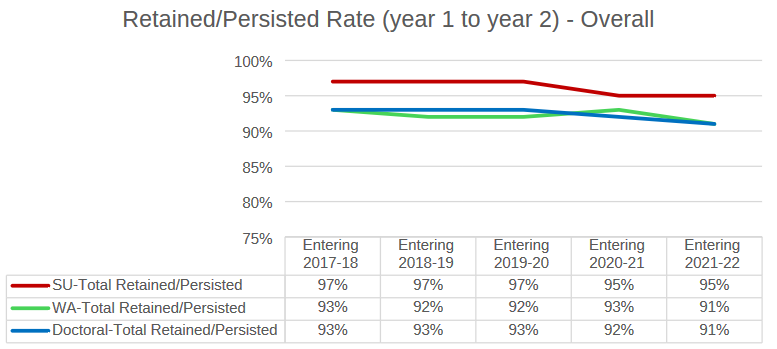
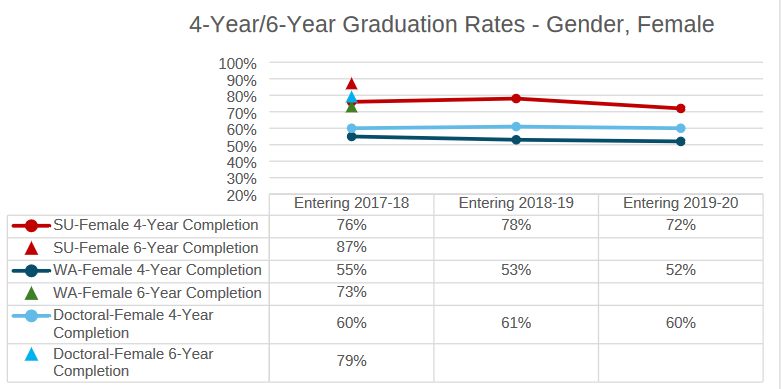
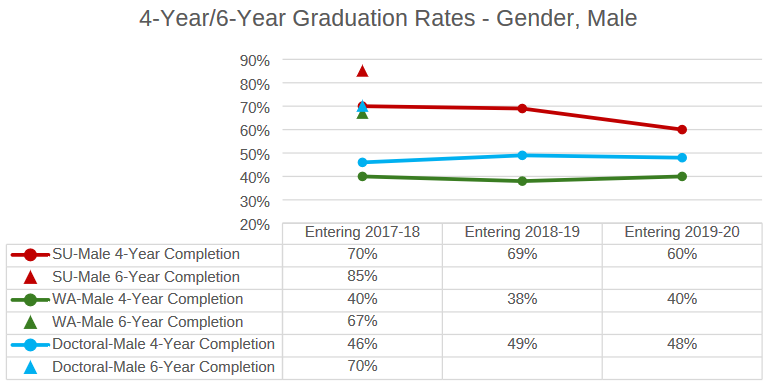
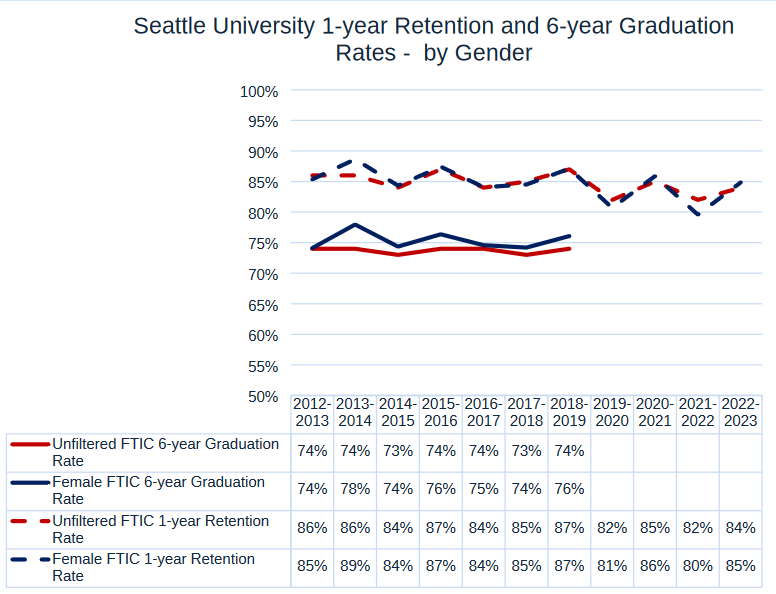
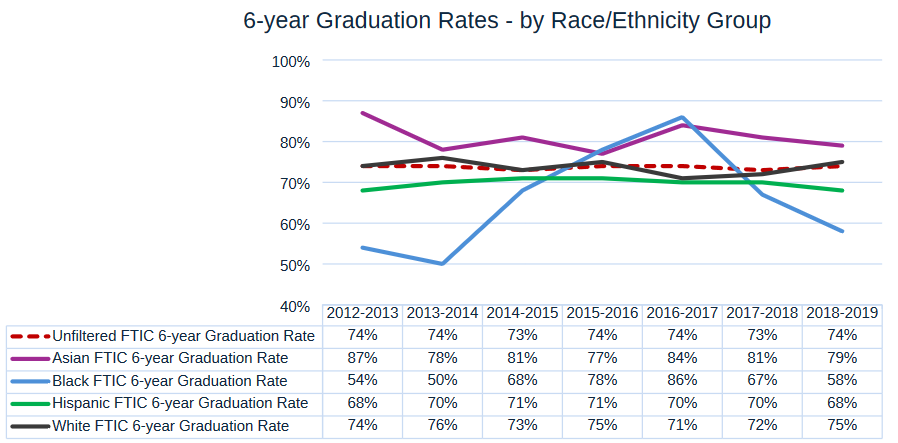
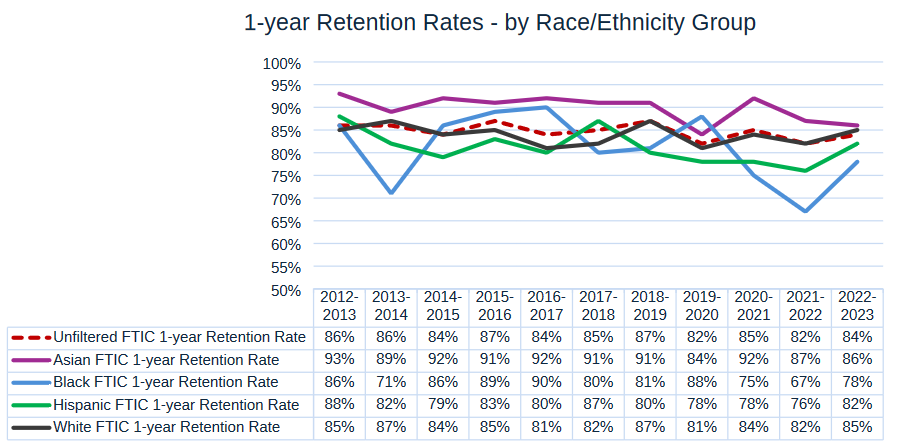
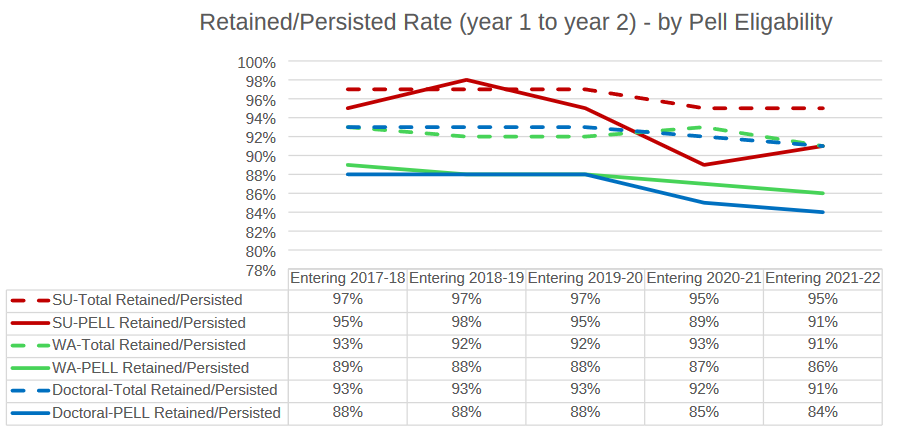
To ensure the diverse population of Seattle University students is well-served, the university benchmarks retention and graduation rates for various student populations through the National Student Clearinghouse Peer Data Partnership program (PDP). The graphs below compare four-year graduation rates for the three most recent entering cohorts of first-time full-time undergraduates and six-year graduation rates for the cohort entering in the 2017-18 academic year with all doctoral level universities and all Washington state four-year colleges and universities participating in the PDP. Benchmarked data is supplemented with Seattle University data to provide a longer historical context and/or additional detail.
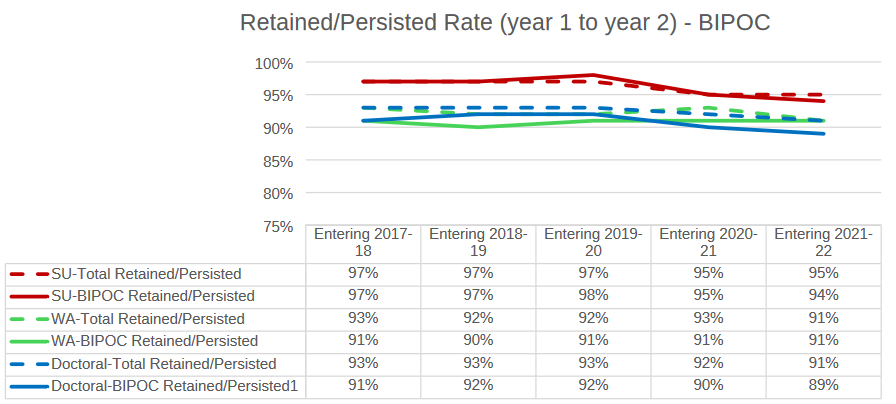
All Black, Indigenous, and People of Color (BIPOC) Students
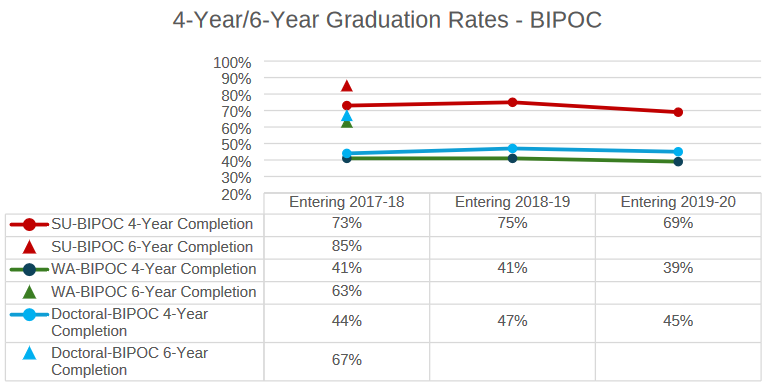
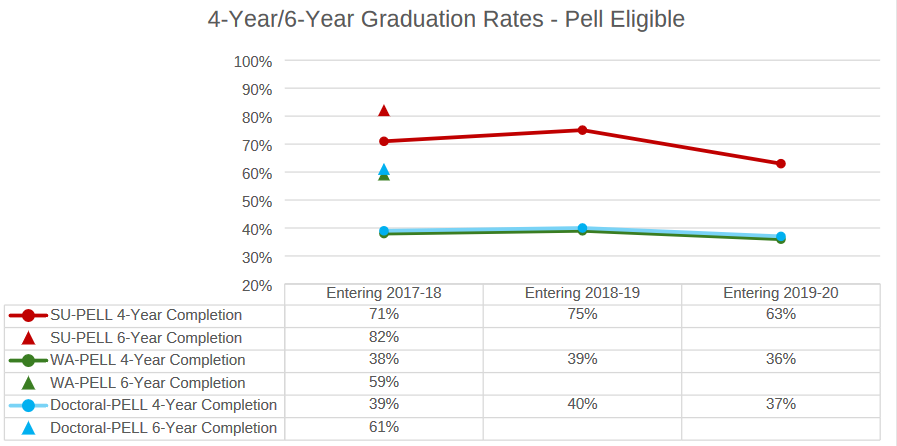
Note: PDP data for Washington State colleges not available
Note: PDP data for Washington State colleges not available