
TerminalFour's work area is called "Site Manager."
Within Site Manager, you will find three main areas:
- Navigation bar - black colored navigation bar along the top of the page
- Dashboard - typically viewed on the left-hand side of the page
- Unless you're using TerminalFour on a screen or browser with a narrow width, in which case, the Dashboard will be hidden but can be accessed by clicking on the three bars which appear on the top left in the navigation bar
- Site structure - list of sections (folders) which contain all of the content on the Seattle University websites that you have permission to access and edit
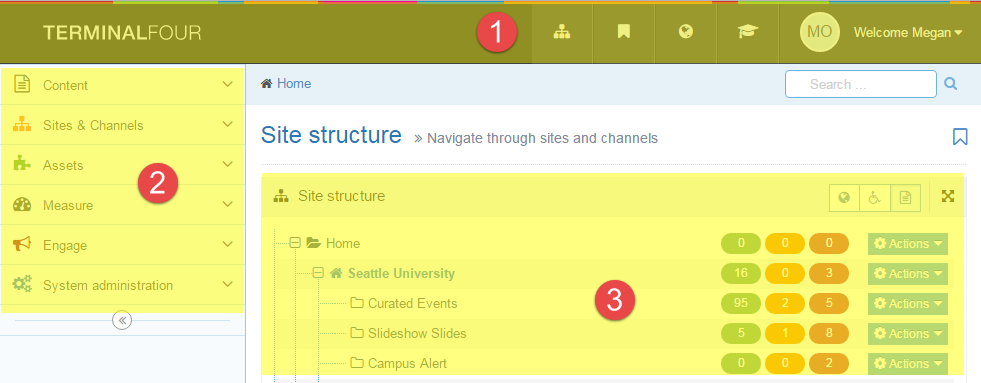
Navigation Bar
The black navigation bar consists of five navigation objects:
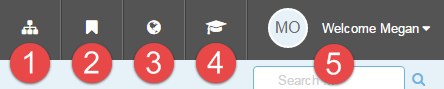
- Site Structure
- If you ever get lost and you want to get back to the starting point, you can return to the primary screen by clicking the site structure icon.
- This button is better to use than the "back" button in your browser.
- Bookmarks
- If you have added any bookmarks, you can view a list of your bookmarks by clicking this second icon.
- Language Options
- If we had multiple languages enabled, you would click here to choose between different language options. However, here at Seattle U, we have only enabled one language option – English.
- Access the TERMINALFOUR Community
- By clicking this icon, you will be able to access the T4 Extranet Community.
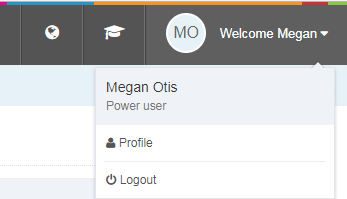
- Profile / Logout
- You can view your user type, access/edit your user profile, and log out by clicking here.
Dashboard
The Dashboard navigation looks different depending on your user type/permissions level and gives you quick and easy access to certain tools within TerminalFour.
Of note, all content editors can get easy access to the Media Library by clicking the "Content" menu in the Dashboard.
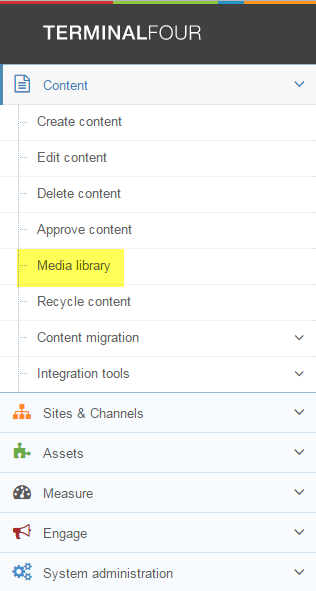
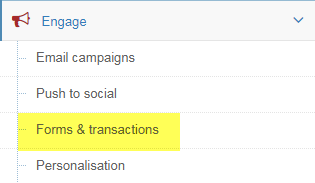
If you have a "power user" account, you can get easy access to the Forms tool by clicking the "Engage" menu and selecting "Forms and Transactions."
Site Structure
The center column is your Site Structure and it contains all the different folders (or sections) of the Seattle U website which you have permission to access.
Folders or sections in TerminalFour often equates to a page on the website. The pages in your navigation menu align with the folders in your Site Structure:
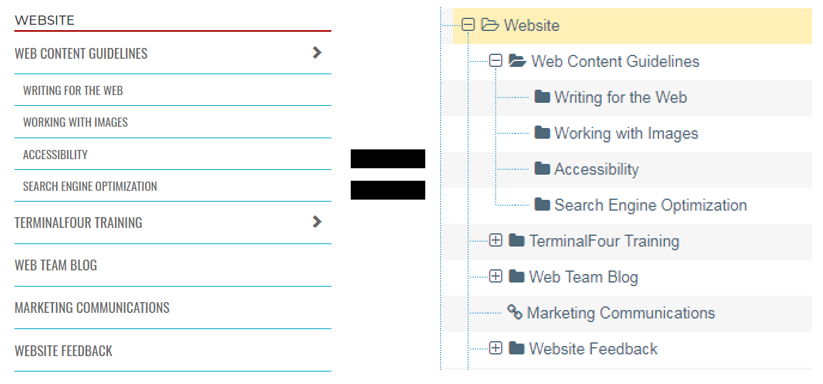
If there is a square with a plus (+) or a minus (-) to the left of the folder, that indicates the section has subsections. You can click the plus to expand or show all of the sub-sections, and click the minus to collapse or hide all of the subsections.
Next to each section, there are three colored ovals: green, orange, and red. Inside each oval is a number which reflects the number of content items in that section which are approved/published (green), pending (orange), and deleted or inactive (red).
Decoding the icons in the site structure
- A dark blue colored folder is a normal published section.
- A white colored folder outlined in dark blue is a published section which is hidden, or not included in the navigation menu.
- An orange colored folder indicates the section is pending, or not yet published.
- A red colored folder indicates the section is inactive, unpublished or deleted.
- A filing box icon indicates the section is archived.
- The icon which looks like two little chain links indicates an internal link section.
- A square with an arrow pointing outward indicates an external link section.
- Two overlapping squares indicates a mirrored section.
The blue “Actions” button on the far right of each section allows you to add a new subsection or edit, preview, move, mirror, duplicate, delete, or publish the section.
You can also add, edit or delete content within the section from the Site Structure.
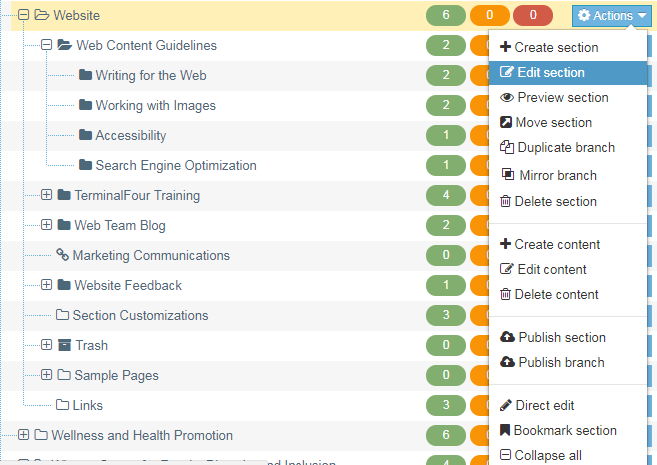
Select the section you want to modify by either clicking the name of the section or by clicking the blue "Actions" button on the right and selecting "Edit section."