
This article, written by Alumna Sara Beery, '16, is featured in XRDS, The ACM Magazine for Students. Due to technological advances including computer vision, machine learning and the work of researchers like Sara, massive amounts of data are being collected and processed for biodiversity monitoring. Learn more about the work, the advances and what is ahead in the article below:
Read the full article, "Scaling Biodiveristy Monitoring for the Data Age"
Biodiversity is declining at an unprecedented rate worldwide. There have been devastating losses of genetic, ecological, and behavioral diversity of species in the last 50 years alone. According to the "2020 Living Planet Report," between 1970 and 2016 we have lost 68% of the populations of mammals, birds, amphibians, reptiles, and fish [1]. This figure jumps to 94% in the American tropics, some of the most highly biodiverse regions in the world. These numbers are the best estimates of global experts based on decades of data, but in many cases, we still don't have enough information to build an accurate understanding of the scope of our current loss and prioritize measures to counteract it. For example, 14% of the threatened sepcies on the International Union for Conservation of Nature (IUCN) Red List are considered data deficient—they may be in even more danger than is currently known [2]. Increased biodiversity monitoring is necessary not only to understand ecosystems and how they are changing in response to climate change and human encroachment but also to get necessary feedback on the effectiveness of conservation actions.
Automatic and manual biodiversity monitoring is in place in many protected land areas. The data collected is used to monitor the size and diversity of species populations across the taxonomic tree. This information is vital to those seeking to preserve natural resources and react quickly to ecosystem threats. The data collected by biodiversity monitoring systems is also used in many aspects of ecological research, including predicting where a species might be found based on environmental variables (species distribution modeling), estimating the size of a population of a certain species in an area (population estimation), and understanding changes in plant and animal behavior in reaction to human encroachment and climate change. However, most data processing and analysis is done manually, which prevents these systems from scaling up spatiotemporally and taxonomically to the magnitude of data necessary to capture complex global ecosystem dynamics in near real-time.
 Biodiversity Monitoring's Data Challenge
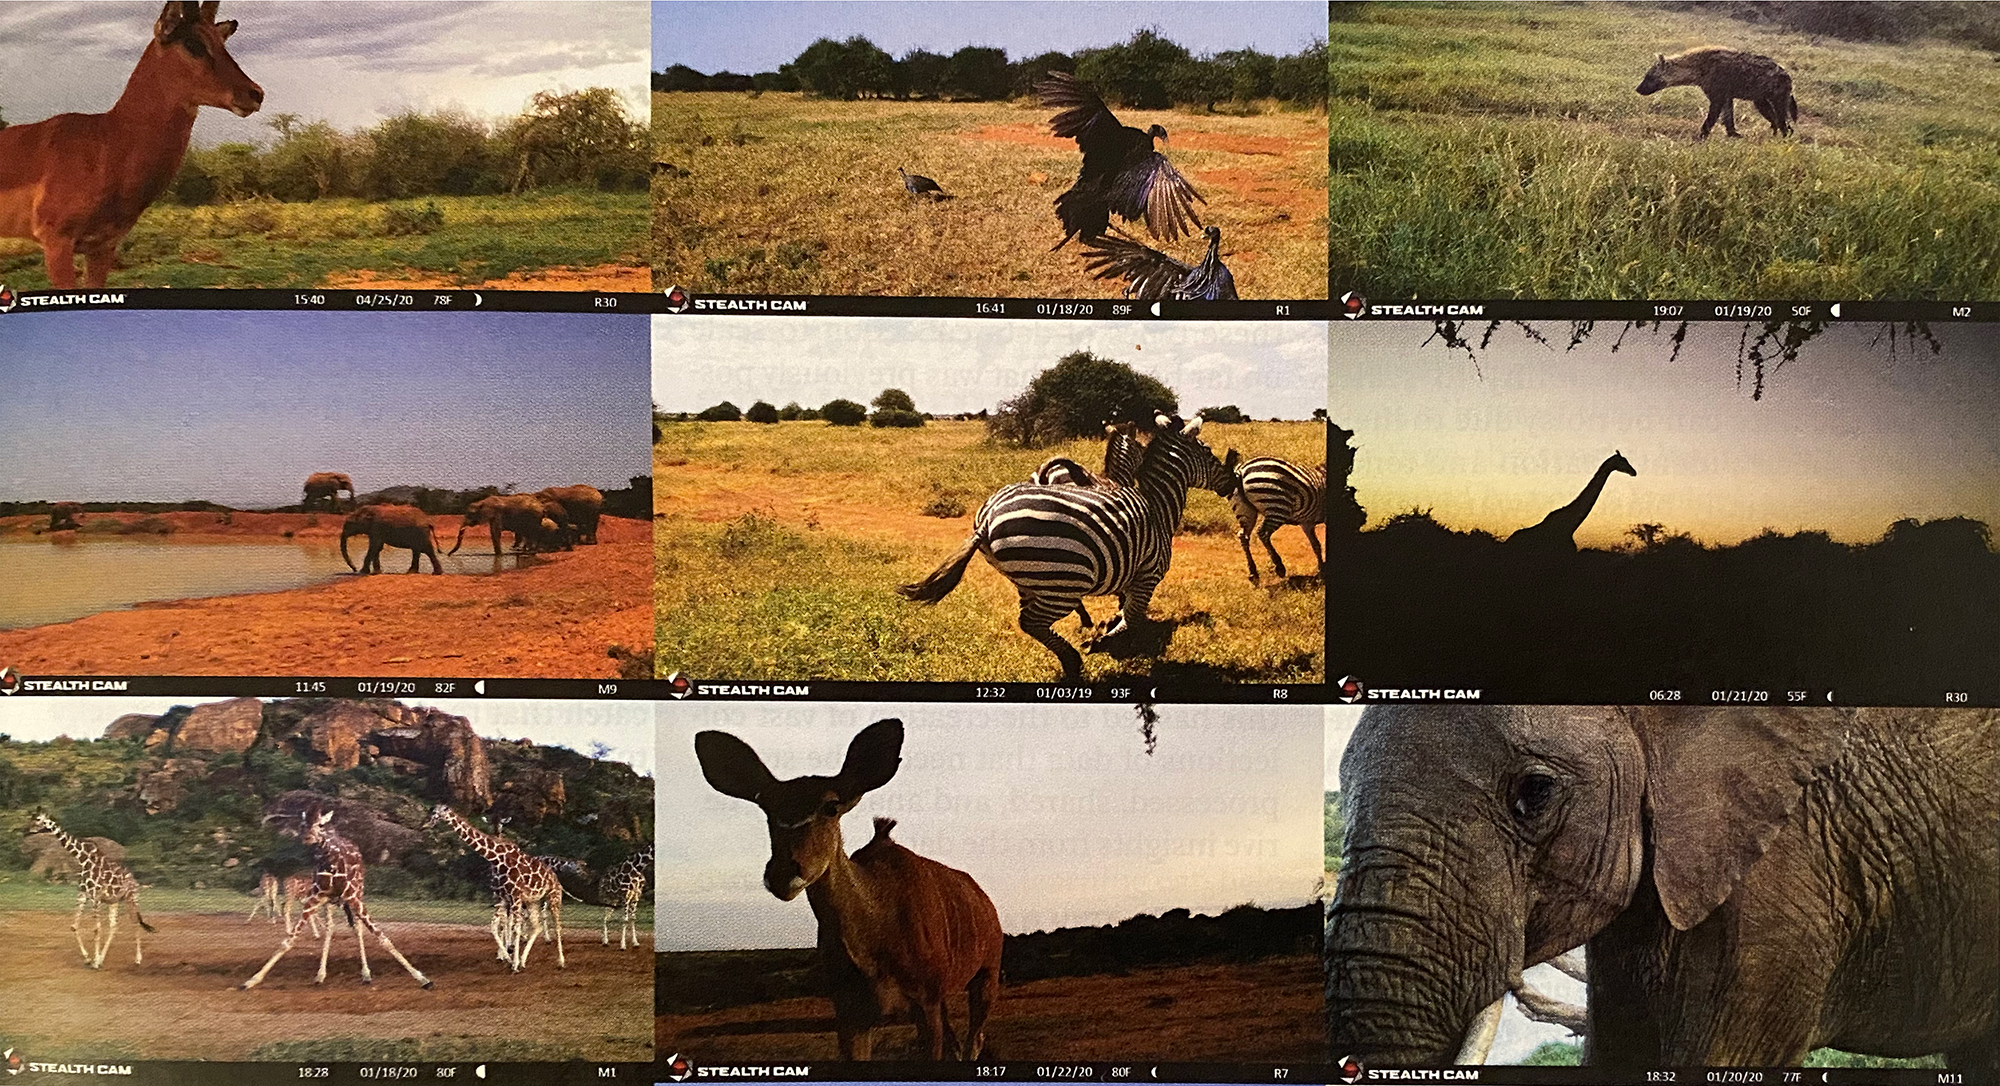
Biodiversity data can be time-consuming and expensive to collect, as it frequently relies on humans manually collecting samples or purchasing, deploying, and maintaining networks of sensors—often cameras or microphones—in the field (see Figure 1). In addition to the cost of data collection, experts must invest significant effort to filter, categorize, and analyze the resulting data. Even small-scale biodiversity monitoring systems can generate data far faster than researchers can analyze it. For example, it can take years for scientists to manually process and interpret a single season of data from a network of camera traps. Producing real-time estimates of fish escapement upstream—necessary to maintain sustainable fisheries—requires teams of field ecologists working in shifts to watch near-continuous streams of sonar data [3]. Only a handful of monitoring points can be managed with this level of effort. The challenge is even greater for taxa that are studied by trapping and collecting, such as beetles and other insects. Entomologists can collect thousands of beetles in a few days, but it may require months or years for a suitable expert to exhaustively identify all of the specimens to the species level. This pace and scale of analysis cannot keep up with the impact of human activity and a rapidly changing climate. To make effective conservation decisions, policymakers need to know how different ecosystems are reacting quickly and in greater detail.
Luckily, new advances in technology, data collection, data processing, and data management are making it possible to scale and speed up biodiversity monitoring efforts worldwide. These advances provide a diverse perspective on our natural world, capturing data at different scales and across modalities.
Since the advent of global-scale Earth observation missions in the 1970s, remote sensing data collected from satellites, and low-flying aircraft has been used as a proxy for direct biodiversity observations, including monitoring forest habitat intactness and estimating populations of large colonies of birds. However, the high-spatial-resolution imagery necessary for direct wildlife observation and analysis can only be collected with aircraft and more recently, drones, which are expensive, restricted in some geographies, and sometimes dangerous to operate.
Data collected from fixed networks of sensors such as camera traps, phenocams, bioacoustic sensors, and sonar provide consistent temporal sampling, allowing ecologists to monitor changes over time. Camera traps, for example, provide inexpensive high-resolution in situ imagery, even under the forest canopy, and are used by ecologists to monitor a broad set of wildlife species.
On-animal sensors, like GPS collars and radio tags, are used to track single animals and provide remarkable insight into animal behavior and movement patterns. They are also used to collect contextual environmental metadata, such as ambient temperature. Manually collected samples of insect populations, scat, or soil can be used in eDNA analysis, which is able to recognize genetic barcodes for species. This can be used to provide insight into animal behavior and species interactions, such as which species are drinking at a given watering hole. However, placing on-animal sensors is invasive, labor intensive, and sometimes very expensive.
Community scientists can collect vast sets of species observation data via images, sound recordings, or species checklists, which are community and expert curated in data repositories, such as iNaturalist and eBird. These data collection methods have an impressive ability to scale, but the data can be noisy due to inexpert species identification and tends to be spatially biased towards areas of high human traffic, like cities or well-traveled nature preserves.
Each data collection method is optimal for some subset of species, areas, and monitoring needs. They are complementary—no one data collection method can capture the entire biodiversity picture. Together they span the tree of life and the globe. Recent reductions in sensor costs have allowed many of these types of data collection to scale up far beyond what was previously possible. The existence of open-source, modular, and accessible data collection systems, such as AudioMoth [4] and FieldKit,1 are helping to build strong communities of conservation technologists. These groups share resources, best practices, and even source code. All this has led to the creation of vast collections of data that need to be stored, processed, shared, and analyzed to derive insights from the data.
Biodiversity Data Poses New Challenges for Machine Learning
Machine learning models trained on large repositories of data curated by teams of experts now play a role in everything from self-driving cars to Instagram filters. The success of these systems, as well as their ability to process large, complex datasets efficiently, have led ecologists and conservation technologists to explore how machine learning can be used to help monitor our planet. There have been hundreds of papers in the last year alone applying machine learning and computer vision methods across the breadth of biodiversity data sources (see Figure 2). As further incentive for ecologists to explore automated data processing methods, there is a large amount of "bycatch" hidden in the data. For example, observations of certain plant species can be extracted from imagery originally collected for wildlife monitoring. From the point of view of a wildlife researcher, the plant images are by-catch that they don't have the capacity to label or curate from their existing datasets. Targeted and well-trained machine learning models could do so quickly and scalably, drastically increasing the accessibility of bycatch observations and the taxonomic scope of our current databases.
Machine learning is already being used in practice to process ecological data at scale. The Microsoft AI for Earth MegaDetector [5]—an animal, human, and vehicle detection model for camera trap data—is used as a first data filtration step in the ecological data pipelines of more than 30 organizations worldwide, including the Wildlife Conservation Society, San Diego Zoo Global, and Island Conservation. The publicly-hosted MegaDetector API is queried hundreds of thousands of times per month. The model works off-the-shelf for most camera trap data due to a combination of community building, data science, and machine learning research. The MegaDetector is trained to localize animals but not predict their species, which has been shown to be more robust to both new species and new camera deployments than species-specific models [6]. There is a significant need in the camera trapping community to filter out images containing animals, humans, or vehicles from large sets of mostly empty imagery, and this model does so efficiently and accurately.
However, biodiversity data still presents challenges that are not well addressed by existing machine learning methods.
To begin with, the distribution of species worldwide is long-tailed. This means most observations are for common species, and the vast majority of species have few, if any, observations. This results in highly imbalanced datasets, with the most rare species having insufficient data representation to be learned accurately by traditional machine learning frameworks. Additionally, many biodiversity monitoring sensors collect a large amount of "empty" data, that is, data without any observations of the study's target species (note that this data can still contain valuable information on non-target species—by-catch—that machine learning can help to extract).
It can take years for scientists to manually process and interpret a single season of data from a network of camera traps.
Secondly, machine learning models assume each data point is collected independently from the same underlying distribution. However, many biodiversity monitoring systems capture signals that are correlated in time and space. This sample correlation can result in overfitting to specific deployments, particularly for static sensors or sparsely-sampled drone flights, causing poor model generalization to new deployments.
Finally, the computer vision and machine learning communities usually work on high-quality datasets curated by human experts, with well-framed objects of interest and clean, accurate data labels. By contrast, biodiversity monitoring data is collected from sensors with limited intelligence, such as camera traps that collect data based on motion triggers. This leads to observations of interest that are too close or too far from the sensor, low resolution, or obscured by noise. Ecological data can also require expertise to categorize correctly. This involves challenging tasks like distinguishing between species of gulls or identifying species-specific behaviors. Labels curated by community scientists or non-experts frequently contain errors. Unlike relatively simple classification tasks, such as identifying stop signs on a street, building machine learning models for biodiversity monitoring requires technologists to connect task-specific expert knowledge with machines and data.
These challenges provide an exciting opportunity for the computer vision and machine learning research communities to develop creative solutions. New methodologies are being developed to tackle these challenges, with expert ecologists providing data, guidance, and much-needed context for different sensor types and taxa. Exciting recent work includes using synthesized data for rare species to improve rare-class performance [7], incorporating learned geospatial priors to improve species identification by letting the model know which species are most likely to be seen in a given area at a specific time [8], and building models that can share information across data collected by a given static sensor, helping the model adapt to previously unseen environments [9].
My Data is Your Data, Making Data Accessible
This massive uptick in the amount and variety of data being collected and processed has necessitated the creation of data standards, data management tools, data sharing repositories, data aggregation, and analysis platforms. All of these share a similar goal: to help ecologists and conservationists easily and effectively share data and insights. Large-scale data repositories, such as the Global Biodiversity Information Facility (GBIF) and the Macaulay Library, pull together occurrence records and media from scientific studies and other large-scale but more targeted data collection and management platforms. These latter include iNaturalist for community science species observations (currently at 64M observations worldwide) and Wildlife Insights for networks of static camera traps (currently at 12.6M global camera trap images). Analysis platforms, such as Map of Life, seek to aggregate and analyze data from global repositories, governmental surveys, and scientific publications in order to produce ecological insights. Map of Life finetunes IUCN global range maps for most species on earth.
No one data collection method can capture the entire biodiversity picture. Together they span the tree of life and the globe.
Aggregating data allows researchers to share the cost and scale up, in collection effort, data processing effort, and across jurisdictions. These repositories provide the necessary framework for researchers to combine their efforts, but there are many challenges that biodiversity monitoring and modeling systems still face. As mentioned earlier, different data types have biases based on where the data is collected, or which species are likely to be seen. One of the biggest open challenges in biodiversity monitoring is how to understand and compensate for the sampling biases of each of these types of data, while still benefiting from their complementary geospatial and taxonomic coverage in order to build an accurate, unbiased picture of our world's biodiversity.
Looking to the Future
Complementary and parallel technological advances in data collection, data processing, and data management are driving the field of biodiversity monitoring forward every day, and there is a growing interdisciplinary community of researchers sharing resources, best practices, and skills. The machine learning community has shown ever-growing interest in tackling biodiversity data challenges, with increasing numbers of biodiversity-focused workshops,2,3 and competitions,4,5 seen each year [10]. Looking to the future, the accessibility and standardization of ecological data will allow us to build systems that can efficiently answer increasingly detailed ecological questions at scale. They will go beyond merely identifying the species in a given image to answering questions about their number, their age, the behaviors they are exhibiting, and how they are interacting with the environment [11]. As we build robust data collection, processing, and management systems across different data modalities we can share context and fill in spatial, temporal, and taxonomic data gaps. We can aggregate information from remote sensing, passive and active monitoring sensors, ecological samples, and the natural history record to paint a cohesive picture of global biodiversity and help fight to protect it.
References
[1] Almond, R. E. A., Grooten, M., and T. Peterson, T. (Eds). Living Planet Report 2020-Bending the curve of biodiversity loss. World Wildlife Fund, 2020.
[2] IUCN Red List Committee. The IUCN Red List of Threatened Species - Strategic Plan 2017–2020. Prepared by the IUCN Red List Committee, 2017.
[3] Alaska Department of Fish and Game. Kenai (RM 14) River. Alaska Fisheries Sonar; https://www.adfg.alaska.gov/index.cfm?adfg=sonar.site&site=17
[4] Hill, A. P., Prince, P., Covarrubias, E. P., Doncaster, C. P., Snaddon, J. L., and Rogers, A.. AudioMoth: Evaluation of a smart open acoustic device for monitoring biodiversity and the environment. Methods in Ecology and Evolution 9, 5 (2018), 1199–1211.
[5] Beery, S., Morris, D., and Yang, S. Efficient pipeline for camera trap image review. In the Data Mining and Artificial Intelligence for Conservation Workshop at Knowledge Discovery in Databases (KDD). 2019.
[6] Beery, S., Van Horn, G., and Perona, P. Recognition in terra incognita. In Proceedings of the European Conference on Computer Vision (ECCV). Springer, 2020, 456–473.
[7] Beery, S., Liu, Y., Morris, D., Piavis, J., Kapoor, A., Joshi, N., Meister, M., and Perona, P. Synthetic examples improve generalization for rare classes. In Proceedings of the IEEE/CVF Winter Conference on Applications of Computer Vision, 2020, 863–873.
[8] Mac Aodha, O., Cole, E., and Perona, P. Presence-only geographical priors for fine-grained image classification. In Proceedings of the IEEE/CVF International Conference on Computer Vision, 2019, 9596–9606.
[9] Beery, S., Wu, G., Rathod, V., Votel, R., and Huang, J. Context R-CNN: Long term temporal context for per-camera object detection. In Proceedings of the IEEE/CVF Conference on Computer Vision and Pattern Recognition (CVPR). IEEE, 2020, 13075–13085.
[10] Cole, E., Deneu, B., Lorieul, T., Servajean, M., Botella, C., Morris, D., Jojic, N., Bonnet, P., and Joly, A. The GeoLifeCLEF 2020 Dataset. arXiv preprint arXiv:2004.04192. 2020.
[11] Van Horn, G., Cole, E., Beery, S., Wilber, K., Belongie, S., and Mac Aodha, O. Benchmarking representation learning for natural world image collections. In Proceedings of the IEEE/CVF International Conference on Computer Vision (CVPR). IEEE, 2021.
Author
Sara Beery has always been passionate about the natural world. Recognizing a need for technology-based approaches to conservation and sustainability challenges, she joined the Ph.D. program at Caltech with adviser Dr. Pietro Perona. Her research, which focuses on computer vision for global-scale biodiversity monitoring, is funded by an NSF Graduate Research Fellowship, a PIMC0 Data Science Fellowship, and an Amazon AI4Science Fellowship. She works closely with Microsoft AI for Earth and Google Research to translate her work into easily accessible tools for the ecological community. Beery's experience as a professional ballerina and a nontraditional student has taught her the value of unique perspectives in the research community, and she is passionate about increasing diversity and inclusion in STEM through mentorship, teaching, and outreach.
Footnotes
2. AI for Animal Re-Identification Workshop at WACV 2020; https://sites.google.com/corp/view/wacv2020animalreid
3. Data Mining and AI for Conservation Workshop at KDD 2019, https://sites.google.com/corp/usc.edu/kdd19-dmaic-workshop/home
4. iWildCam 2021; https://sites.google.com/view/fgvc8/competitions/iwildcam2021
5. GeoLifeCLEF 2020; https://www.imageclef.org/GeoLifeCLEF2020
Figures
 Figure 1. Ecological data is collected in many different ways. (a) Camera traps, (b) community science projects, (c) and aerial surveys are three types of ecological data currently collected to help monitor biodiversity. Each of these data collection types generates vast amounts of data, making it difficult to analyze the data by hand and extract insights quickly.
 Figure 2. Machine learning models can be used to automatically extract relevant ecological information directly from the raw data. For example, computer vision detection models can be used to find and categorize animal species in images collected by camera traps.
 Figure 3. Global data curation platforms, such as the Global Biodiversity Information Facility, are curating data from many different types of sensors and across ecological studies, and aggregate data from sensor-specific data management and hosting platforms, such as Wildlife Insights. However, there are biases in where and when data was collected and how much data is available for a given species, and these biases are not consistent across sensor types. There are currently many more species occurrence records available in the United States and Europe, but if we look at a global heatmap of biodiversity we see that there is greater diversity in the Amazon, Subsaharan Africa, and East Asia. This means for the areas with the greatest available biodiversity, we have less access to information about how to protect the species that are there, and how those species are being affected by climate change and human encroachment.
Copyright 2021 held by Owner/Author
The Digital Library is published by the Association for Computing Machinery. Copyright © 2021 ACM, Inc.