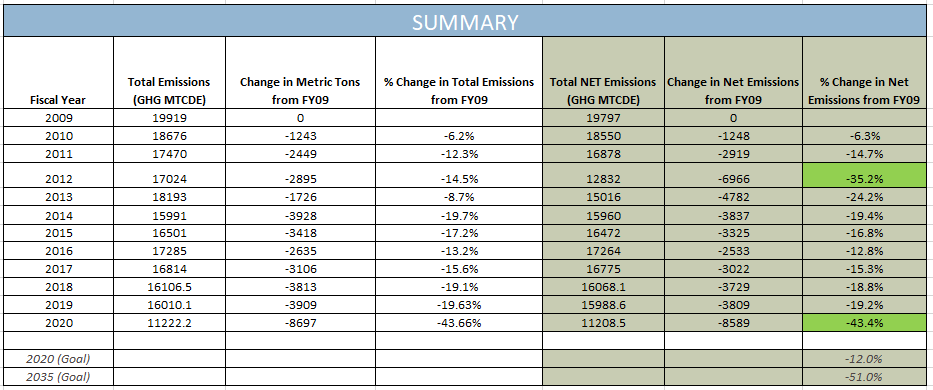
As a signatory to the American College and University Presidents Climate Commitment, Seattle University adopted a Climate Action Plan (CAP) in 2009 stating the university’s intentions to more comprehensively address climate change and advance sustainability. One of the main CAP goals was to reduce greenhouse gas emissions (GHG). In 2009, the university emitted an estimated 19,800 net metric tons of carbon dioxide equivalents. Seattle University committed to work towards climate neutrality and reduce emissions by at least 12% by 2020 and 51% by 2035 from buildings, solid waste, university-owned vehicles, air travel, and commuters to campus.
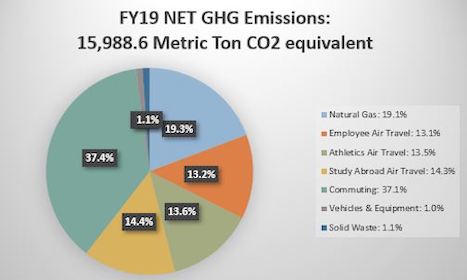
In fiscal year 2019, SU’s greenhouse gas net emissions were 15,990 metric tons which is a 19.0% reduction since 2009. The reduction can be attributed to investments in new campus infrastructure, increased composting, and a decrease in natural gas consumption, single-occupant vehicle commuting, and most importantly air travel by SU employees and students.
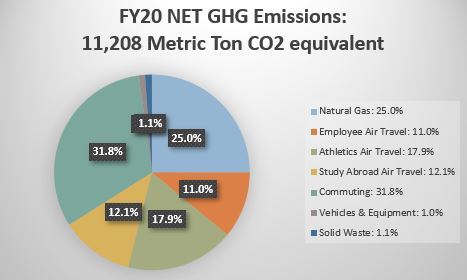
In fiscal year 2020, we recorded a drop of 43% emissions since FY09 and 30% since FY19, mainly as a result of the COVID19 pandemic and consequent reduction in natural gas use for the heating of campus buildings (8% reduction since FY19), commuting to campus (41% reduction since FY19), and air travel (30% reduction since FY19) given the temporary air travel ban SU implemented as a safety measure during the pandemic.